Over these past four years, the total value of Estonia’s hundred largest companies has basically stayed the same, with way to grow to the pre-crisis level. In 2007, the value of 100 biggest native firms amounted to €21.6bn.

Over these past four years, the total value of Estonia’s hundred largest companies has basically stayed the same, with way to grow to the pre-crisis level. In 2007, the value of 100 biggest native firms amounted to €21.6bn.
This year, analysts at M&A International Baltics assumed the task to compile top 100 valuable list from Gild Corporate Finance. The list is in its 8th year of publishing. A company’s value is calculated on the basis of forecast market value of equity capital as at beginning of the year.
According to M&A International Baltics (MAI) partner Heikki Källu, the growth this year mainly came thanks to the methodology of calculating the value. Namely, the value contains two components: results of a definite enterprise, and the market coefficient. The coefficient, in its turn, is impacted by results of reference group companies, investor sentiment and market situation.
«We are seeing that the results of many of our enterprises have stayed flat or have not changed much; meanwhile, the market coefficients have risen rather much. By that, the value of the companies has gone up a lot,» he said.
Start-ups not included
The market coefficients growth, in their turn, has been caused by the widespread printing of money around the world which, according to Mr Källu, has boosted company values on the markets. «On the other hand, it is interesting to watch that this money has not always reached the economy – it has reached the markets, but not always the company results,» said the MAI partner.
But in spite of all that, the 100 top valuable Estonian firms make for a significant part of the state’s economy by providing a quarter of sales revenue and over a third of profits. The companies included in the table employ 72,000 people – over a tenth of the country’s labour force.
Also, the average monthly wages in said enterprises is almost twice the average in the country – €1,756 and €949 gross respectively, in 2013. Last year, the most valuable enterprises exported for a total of €6bn, which is close to a half of the entire exports of the nation.
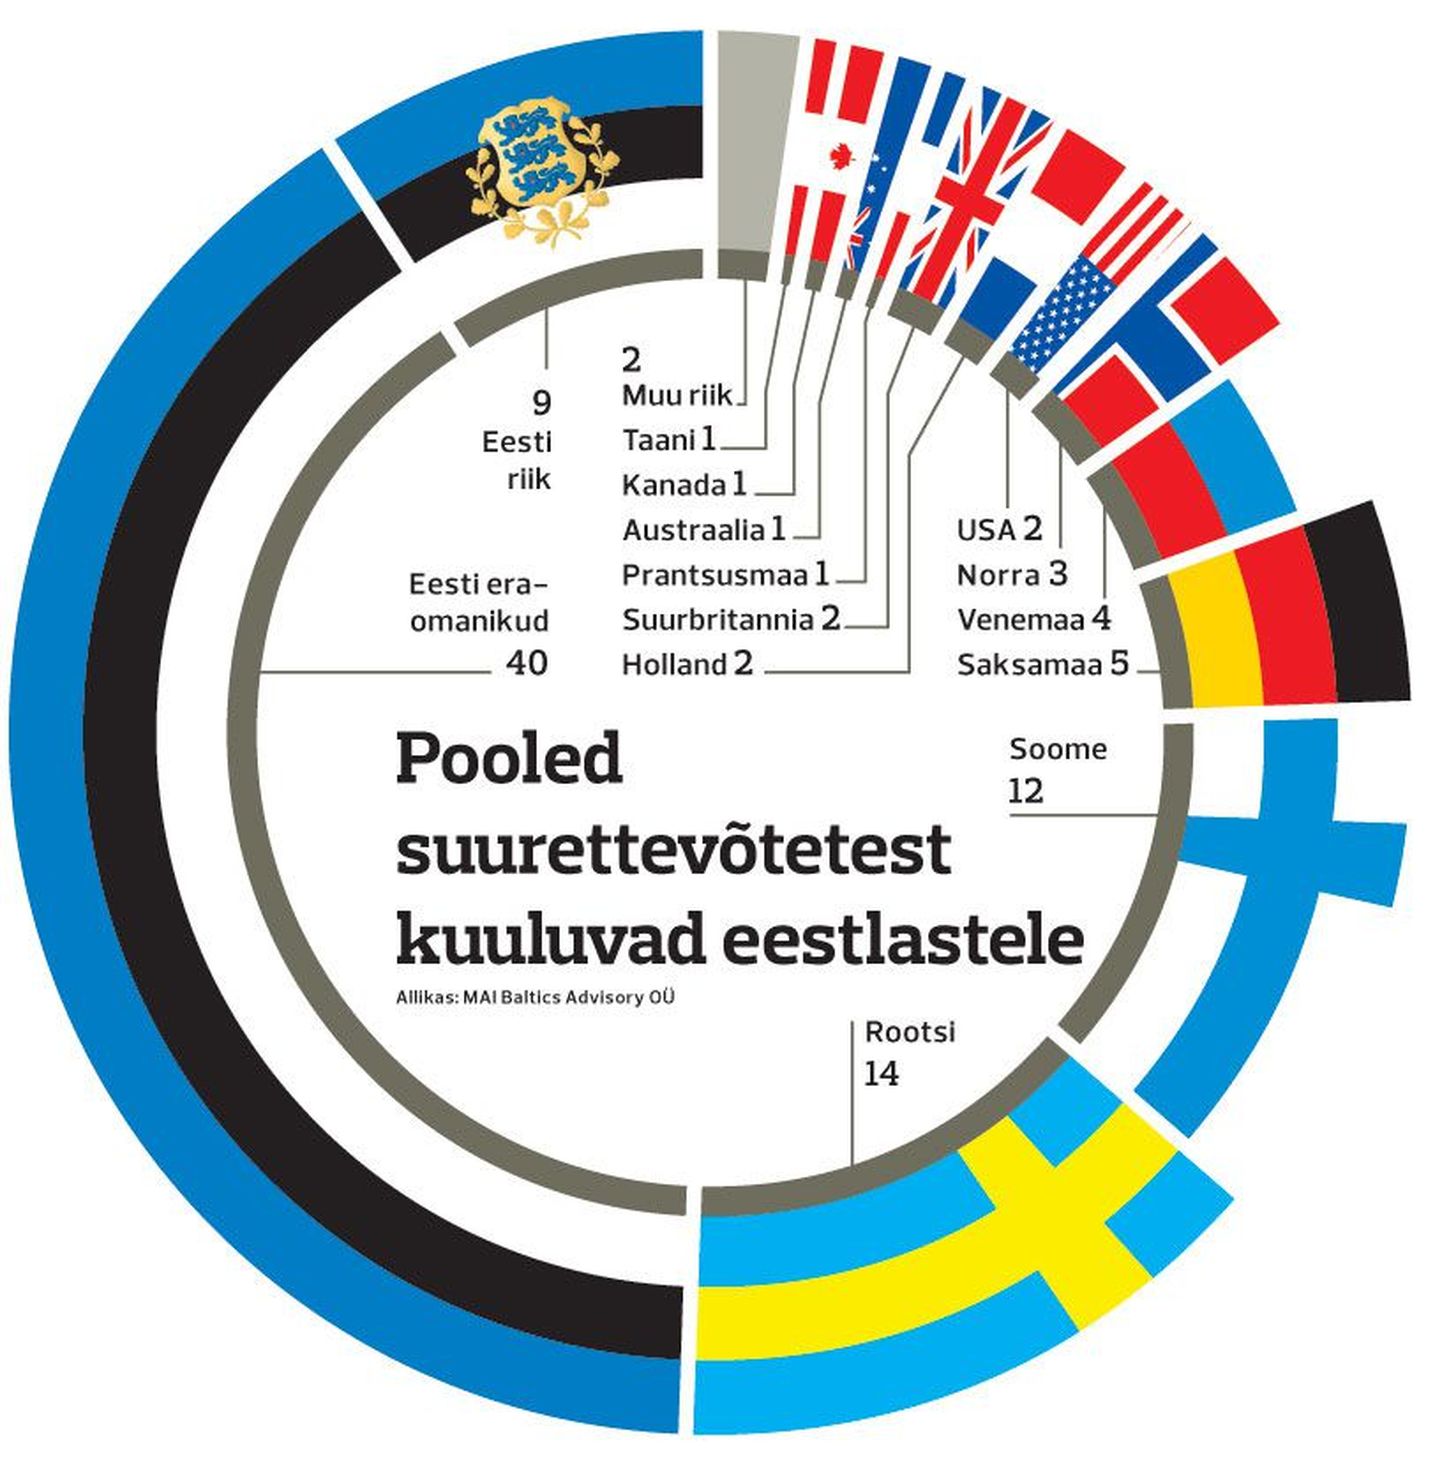
Half of these largest companies are owned by private investors with Estonian background or by the state; mostly, foreign investors are from Finland and Sweden. When also considering the value of the companies, enterprises of Swedish background have an especially large impact on Estonian economy, owning our largest banks (Swedbank, SEB), communication and telecommunication companies (Eesti Telekom, Tele2, Viasat, Starman) and industrial groups (ABB, AGA, Ericsson).
By fields of activity, during a year, he top hundred’s turnover has increased most in trade and utility enterprises (4 percent) and shrunk in construction and telecommunication companies (five-six percent).
According to MAI analysts, the total value of the largest state enterprises is €2.8bn, with Eesti Energia continuing to make up a half of that.
Most of the top hundred firms operate in traditional domains and on relatively developed goods/services markets. The much talked-about start-ups are not in the table, as these are mostly registered abroad and do not fit the criteria of the table.
Rapid growth not in sight
Mr Källu says it’s difficult to predict the fortunes of the companied next year. According to him, markets’ behaviour is impacted by the USA beginning to put an end to printing of dollars, so we’ll see how the markets emerge from that.
«What comes to the results of our companies, obviously the next year economic growth forecasts have been pulled back. Probably, no big fast development is nowhere in sight,» he explained.
«The question rather is, if we are to expect some negative external shocks – the geopolitical situation, the relations with Russia, the oil price. Seems to me the negative risks are more abundant than the upward opportunities. But we’ll see by the end of the year which of these will have real impact and which won’t,» added the MAI partner.
-----------------------------
Comment
Tõnis Oja
Postimees
-----------------------------
How does one measure the size of various companies? What is important – the turnover, the profit, or some other indicator?
Estonia’s oldest company top-list is being compiled by the business daily Äripäev since 1993. The list is based on six indicators: turnover, increase of turnover, operating profit, increase of operating profit, profitability and return on assets. On the basis of points on these rankings, the top 100 list is put together. This is a mechanical aggregate of indicators characterising the company’s size, profitability and growth, which actually does not show much at all.
Toivo Mängel, an author of the Äripäev list idea, recalled in the freshest compilation of the Äripäev lists that they desired to take a bit merrier approach mapping the business landscape – according to today’s understanding, this would mean an approach even sporty and society-like.
For the most part, companies are compared on the basis of two indicators. One is sales revenue or turnover, according to which the world’s best known Fortune 500 is compiled. In the lists put together by Äripäev, the turnover is indeed a component; however, as I said, the newspaper is mostly stressing the aggregate table.
Two years ago, Postimees started to list companies according to turnover only.
The other weighty way to compare companies is according to market value thereof – this is what the Financial Times goes by.
With only 15 companies listed at Tallinn Stock Exchange, it makes not too much sense to list them according to that.
Also, company value may be calculated by indirect measurement i.e. theoretically. This is what, since 2007, has been used by the financial adviser Gild Corporate Finance (now M&A International Baltics).
This list is based on financial indicators of Estonia’s largest enterprises, but they have been compared with other listed companies as well. For every enterprise or sector, a suitable reference group has been compiled out of companies of maximally similar field of operation, region of operation, growth potential, risk profile and profitability listed at various stock exchanges.
In a word, it is attempted to put a price tag on companies – as adequate as possible. But the correctness thereof can only be checked as the company gets listed.
AGGREGATE TABLE:
Highest value companies
Place | Company | Value in 2014 (million €) | Change in value from 2013 (%) | Sales revenue in 2013 (million €) | Profit in 2013 (million €) |
1 | Swedbank AS | 2,023 | +17 | 329 | 214 |
2 | Eesti Energia AS | 1,506 | +29 | 966 | 160 |
3 | SEB Pank AS | 828 | +25 | 126 | 73 |
4 | Tallink Grupp AS | 600 | +3 | 942 | 43 |
5 | Eesti Telekom AS | 571 | +9 | 347 | 42 |
6 | Ericsson Eesti AS | 369 | +12 | 1353 | 20 |
7 | Vopak E.O.S. AS | 366 | –34 | 152 | 34 |
8 | Port of Tallinn AS | 339 | +58 | 102 | 40 |
9 | Elering AS | 318 | +21 | 134 | 49 |
10 | Olympic Entertainment Group AS | 282 | +5 | 136 | 26 |
11 | Viru Keemia Grupp AS | 259 | –11 | 213 | 19 |
12 | Tallinna Vesi AS | 238 | +29 | 53 | 20 |
13 | Tallinna Kaubamaja AS | 216 | –3 | 499 | 17 |
14 | Skinest Grupp AS | 189 | –17 | 182 | 27 |
15 | E.L.L. Kinnisvara AS | 175 | –14 | 40 | 8 |
16 | A. Le Coq AS | 167 | +21 | 81 | 14 |
17 | State Real Estate Ltd | 152 | +1 | 44 | 3 |
18 | Spacecom AS | 151 | –16 | 56 | 19 |
19 | ABB AS | 144 | +30 | 187 | 9 |
20 | PKC Eesti AS | 143 | –31 | 144 | 18 |
21 | BLRT Grupp AS | 142 | +86 | 378 | –14 |
22 | Elisa Eesti AS | 142 | –37 | 95 | 16 |
23 | Eesti Gaas AS | 138 | –16 | 221 | 15 |
24 | Utilitas OÜ | 136 | +135 | 131 | 16 |
25 | Tallinn Airport AS | 135 | +33 | 30 | 5 |
26 | HKScan Estonia AS | 134 | – | 147 | 2 |
27 | Nelja Energia AS | 129 | – | 49 | 13 |
28 | Merko Ehitus AS | 127 | +22 | 263 | 10 |
29 | If P&C Insurance AS | 127 | –28 | 113 | 13 |
30 | Graanul Invest AS | 127 | – | 131 | 10 |
31 | Alexela Logistics AS | 124 | +5 | 85 | 9 |
32 | Eesti Raudtee AS | 111 | +4 | 64 | 11 |
33 | Vesta Terminal Tallinn OÜ | 110 | +7 | 34 | 12 |
34 | DNB Pank AS | 110 | – | 12 | 4 |
35 | Henkel Makroflex AS | 110 | +101 | 99 | 12 |
36 | Rocca Al Mare Kaubanduskeskus AS | 109 | –5 | 15 | 17 |
37 | Silvano Fashion Group AS | 104 | –4 | 122 | 11 |
38 | Saint-Gobain Glass Estonia SE | 101 | +24 | 62 | 7 |
39 | Baltic International Trading OÜ | 99 | – | 813 | 8 |
40 | Fortum Tartu AS | 99 | +22 | 39 | 12 |
41 | Tele2 Eesti AS | 92 | –32 | 67 | 5 |
42 | Baltic Maritime Logistics Group AS | 87 | +4 | 112 | 6 |
43 | Maxima Eesti OÜ | 86 | +33 | 381 | 4 |
44 | Petromaks Spediitori AS | 85 | +34 | 29 | 10 |
45 | Eesti Loto AS | 85 | +61 | 47 | 6 |
46 | Transgroup Invest AS | 84 | –3 | 1 | 13 |
47 | G4S Baltics AS | 82 | –37 | 0 | 2 |
48 | Rimi Eesti Food AS | 82 | +19 | 361 | 3 |
49 | Webinfluence Group AS | 80 | – | 25 | 5 |
50 | Kinnisvaravalduse AS | 78 | +61 | 19 | –11 |
51 | Kunda Nordic Tsement AS | 78 | –5 | 54 | 6 |
52 | Nordea Finance Estonia AS | 77 | +39 | 18 | 13 |
53 | Metaprint AS | 75 | +44 | 41 | 5 |
54 | Saku Õlletehase AS | 75 | – | 71 | 3 |
55 | Stora Enso Eesti AS | 75 | +3 | 189 | 11 |
56 | Magnum AS | 73 | –22 | 284 | 5 |
57 | Bigbank AS | 73 | +27 | 55 | 11 |
58 | Kodumaja AS | 72 | +40 | 52 | 7 |
59 | Wett Eesti OÜ | 68 | –2 | 14 | 3 |
60 | Transiidikeskuse AS | 66 | +14 | 25 | 6 |
61 | Antonio Trade OÜ | 66 | – | 122 | 10 |
62 | Ensto Ensek AS | 65 | +70 | 67 | 7 |
63 | Würth AS | 65 | +75 | 24 | 4 |
64 | Glamox HE AS | 64 | +57 | 29 | 6 |
65 | Santa Monica Networks Group OÜ | 63 | – | 57 | 3 |
66 | Lenne OÜ | 63 | +9 | 24 | 6 |
67 | TREV-2 Grupp AS | 63 | – | 103 | 1 |
68 | Starman AS | 62 | +55 | 30 | 4 |
69 | Silberauto AS | 61 | – | 206 | 7 |
70. | Eesti AGA AS | 60 | +5 | 17 | 4 |
71 | Lennuliiklusteeninduse AS | 60 | +24 | 18 | 4 |
72 | Ramirent Baltic AS | 60 | +44 | 30 | 4 |
73 | Baltic Sea Bunkering OÜ | 60 | – | 187 | 7 |
74 | Krimelte OÜ | 59 | –10 | 81 | 4 |
75 | ERGO Insurance SE | 59 | –25 | 102 | –1 |
76 | Skype Technologies OÜ | 58 | – | 48 | 6 |
77 | Orica Eesti OÜ | 58 | – | 27 | 5 |
78 | Järve Kaubanduskeskus OÜ | 57 | +27 | 8 | 3 |
79 | Statoil Fuel & Retail Eesti AS | 56 | –8 | 219 | 3 |
80 | Tartu Mill AS | 55 | – | 116 | 4 |
81 | Mecro AS | 54 | +26 | 104 | 4 |
82 | Neste Eesti AS | 53 | +42 | 316 | 5 |
83 | Top Connect OÜ | 53 | –36 | 59 | 3 |
84 | Elme Messer Gaas AS | 53 | –12 | 38 | 2 |
85 | Leibur AS | 52 | +5 | 32 | 4 |
86 | Alexela Group OÜ | 51 | – | 239 | 8 |
87 | Pro Kapital Grupp AS | 51 | –6 | 12 | –3 |
88 | DBT AS | 50 | –44 | 31 | 6 |
89 | Lemeks AS | 49 | +18 | 90 | 6 |
90 | JELD-WEN Eesti AS | 48 | +12 | 51 | 5 |
91 | Norma AS | 48 | +2 | 61 | 2 |
92 | Eesti Post AS | 48 | +3 | 54 | 2 |
93 | Mainor Ülemiste AS | 47 | – | 3 | 4 |
94 | Sandmani Grupi AS | 47 | – | 76 | 4 |
95 | Harju Elekter AS | 47 | +2 | 48 | 5 |
96 | Hebron OÜ | 45 | – | 127 | 1 |
97 | Horizon Tselluloosi ja Paberi AS | 45 | +6 | 59 | 4 |
98 | Toftan AS | 45 | –5 | 42 | 6 |
99 | UPM-Kymmene Otepää AS | 45 | +16 | 30 | 4 |
100 | Tamro Eesti OÜ | 44 | – | 79 | 4 |
With companies not in top 100 last year, change of value is marked as –.
Source: MAI Baltics Advisory OÜ